Quebec Traffic Accident Dashboard – Every year, Quebec’s Ministry of Transportation publishes detailed data on road accidents. In 2021, the province recorded over 100,000 incidents, a figure rich with implications for urban safety, infrastructure, and public policy. To help make this information more accessible and actionable, I developed an interactive Quebec traffic accident dashboard as a portfolio project for Adnia Conseils Inc., transforming the raw dataset into a clear, visual, and easy-to-navigate report.
The dashboard includes data from 2014 to 2021, allowing for historical comparison and trend analysis. Due to changes in the data publication system by the Société de l’assurance automobile du Québec (SAAQ) starting in 2022, access to more recent data became limited. This dashboard uses the most complete and structured datasets available prior to that change.
🔗Explore the dynamic version online. Click here!
Page 1: High-Level Overview and Core Metrics
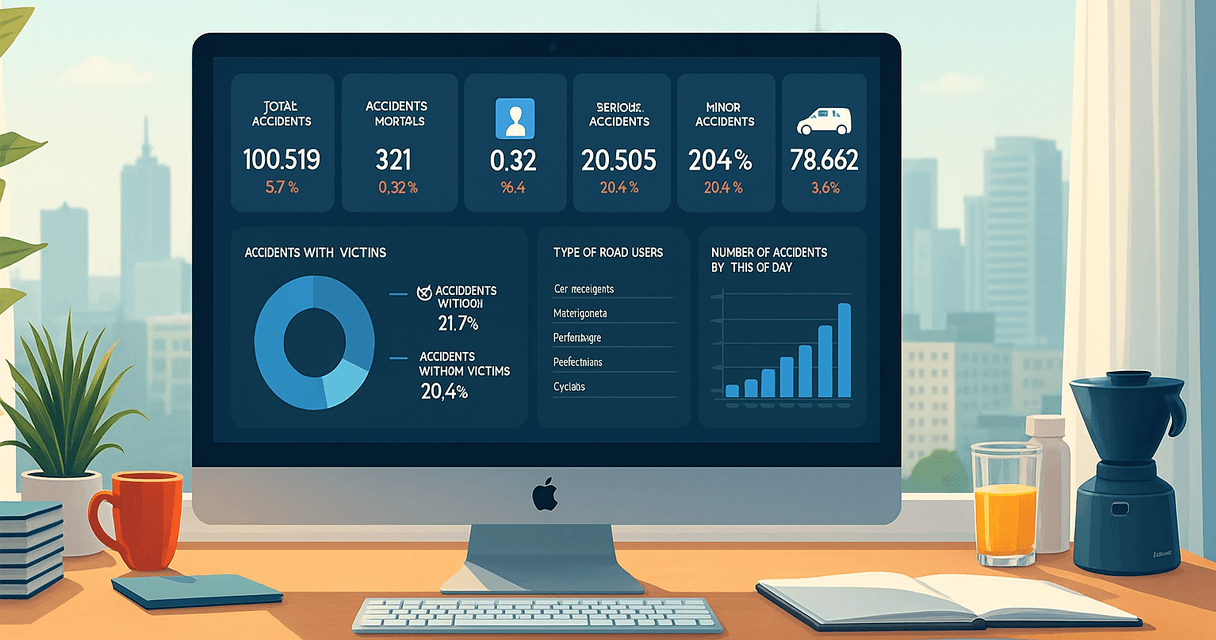
The first page of the Quebec traffic accident dashboard presents a structured snapshot of Quebec’s road safety data in 2021. It’s divided into key visual components, allowing for both instant assessment and deeper exploration.
Summary Cards (KPI Tiles)
The top row includes six cards that immediately communicate the core distribution of accidents:
- Total Accidents: 100,519 cases reported, representing a 5.7% increase from the previous year.
- Fatal Accidents: 321 incidents, making up 0.32% of total cases.
- Serious Accidents: 1,031, which represents 1.03% of the total.
- Minor Accidents: 20,505 (20.4%).
- Material Damage Only: 78,662 (78.3%).
- Year-over-Year Variation: Displayed below each metric in red or blue to indicate growth or reduction.
This layout makes it easy for users to see at a glance how the situation evolved over time.
Victim and Injury Breakdown
On the left, a donut chart distinguishes between accidents with and without victims. In 2021:
- 21.74% of accidents involved at least one victim.
- 78.26% resulted in material damage only.
Alongside it, a detailed table breaks down the number of injured individuals:
- Light injuries: 26,314 people (up 14.6%).
- Serious injuries: 1,227 cases (up 5.3%).
- Fatalities: 347 (up 2.1%).
This table supports both year-over-year comparison and risk profiling by injury type.
Accidents by Time of Day
The bar chart at the bottom-left visualizes when most accidents occurred. As expected:
- The peak hours are between 16:00 and 18:00, aligning with evening rush hour.
- There’s also a rise between 11:00 and 14:00, possibly linked to midday traffic and delivery operations.
- The lowest accident frequency occurs during early morning hours (01:00–05:00).
This insight could support targeted enforcement or awareness campaigns during high-risk hours.
Victims by Road User Type
The top-right table presents fatalities by user group:
- Drivers: 212 deaths (62% of total).
- Motorcyclists: 67 deaths (unchanged from the previous year).
- Pedestrians: 52 fatalities.
- Cyclists: 16 deaths, up 14.3%.
This highlights where public safety efforts (e.g., bike lanes, pedestrian crossings) may need reinforcement.
Accident Types by Cause
The dashboard also lists accident types and their outcomes. For example:
- Vehicle-to-vehicle collisions: 62,129 accidents, 158 deaths.
- Pedestrian-related collisions: 2,107 accidents, 47 deaths.
- Collisions with cyclists: 1,604 accidents, 15 deaths.
These segments offer a foundation for targeted prevention strategies by transport authorities.
Page 2: Environmental Conditions and Analysis
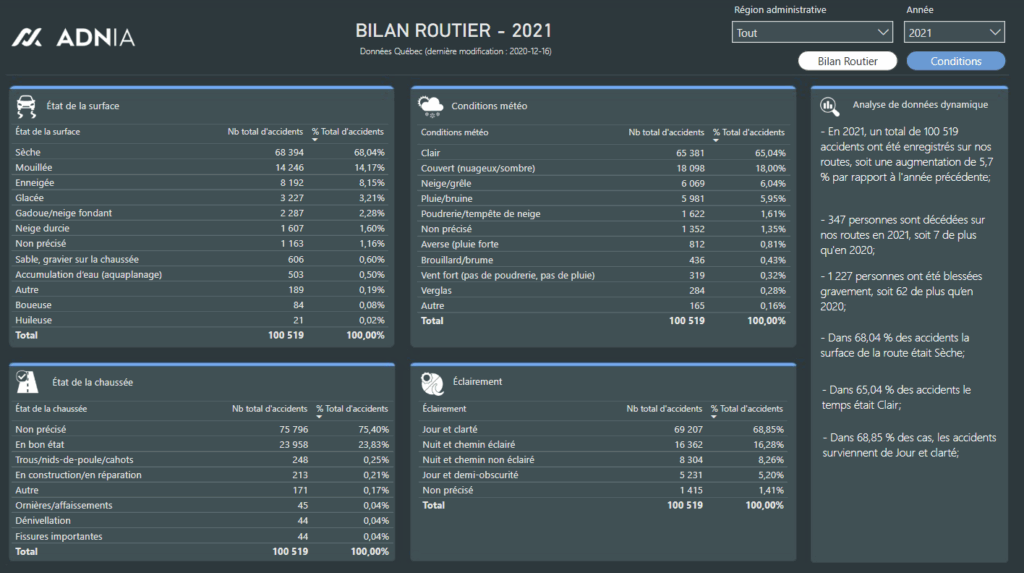
The second page of the Quebec traffic accident dashboard focuses on the broader context—conditions that may have contributed to or influenced the frequency and severity of road accidents.
Road Surface Conditions
A large table displays the surface condition during each accident:
- Dry roads: 68,394 accidents (68.04%).
- Wet roads: 14,246 (14.17%).
- Snow or ice: Roughly 13% combined.
Surprisingly, most accidents occur on dry surfaces, which challenges assumptions that poor weather is always the leading factor.
Weather Conditions
Accidents by weather show:
- Clear weather: 65,381 cases (65.04%).
- Overcast/Cloudy: 18,069 (18%).
- Snow or storm conditions: Less than 7%.
Again, these insights suggest human factors may play a larger role than climate in most incidents.
Lighting and Visibility
Conditions related to visibility are often overlooked. This table breaks down accident frequency by lighting:
- Daylight: 69,207 accidents (68.85%).
- Night (well-lit): 16,362 (16.28%).
- Night (poorly lit): 8,304 (8.26%).
This reinforces the trend that most accidents happen during the day, likely due to higher traffic density, not visibility.
Road Conditions
Most accidents occurred where road conditions were not noted or considered “good”:
- Unspecified condition: 75,796 cases (75.4%).
- Good condition: 23,958 cases (23.83%).
Other issues (potholes, construction) represented less than 1% combined.
Text-based Summary Analysis (Text Intelligence)
On the far right of the dashboard, a text analysis box summarizes the most important findings. These are dynamically generated from the data, helping non-technical users understand:
- Accident growth from previous year
- Total fatalities and serious injuries
- Environmental conditions with highest impact
This feature is essential for accessibility and for users who prefer narrative over visual analysis.
Insights and Takeaways
This Quebec traffic accident dashboard was created not just to showcase design skills, but also to demonstrate how open data can inform policy, improve public safety, and support civic transparency. Some key findings include:
- Most accidents occur in good weather and daylight, suggesting behavior and traffic volume play a key role.
- Evening rush hour is consistently the most dangerous time on the road.
- Driver and cyclist fatalities rose in 2021, indicating areas for safety campaigns.
- Data visualization helps communicate these points faster and more effectively than traditional reports.
Why This Matters
This project shows how public data, when well-structured, can become a strategic asset. It also highlights the potential of Power BI dashboards for creating professional and accessible data narratives based on CSV or open datasets.
- Want to build something similar? Contact me or explore more dashboards on my portfolio page.
Tools Used
- Power BI (indicators, charts, text, etc.)
- Power Point (background)
- CSV files from open data portals
- Open public data from Gouvernement du Québec
This project was commissioned by Adnia Conseils Inc. and serves as a demonstration of applied data design for civic and government use cases.